
After Twilio A2P: Using GPT to analyze SMS response rates
If you’ve used Twilio to send text messages in the past few months, you may have had to register an A2P (Application to Person) campaign. That entails connecting your business details — EIN, business address, and point of contact, for example — with your Twilio phone numbers.
The big US carriers like AT&T initiated the requirement, apparently hoping to cut down on burgeoning spam texts. After all, anonymous senders seem more likely to exploit SMS channels and flout spam restrictions.
As longtime Twilio users, we jumped through the new hoops and wondered how they might impact user response rates.
Background
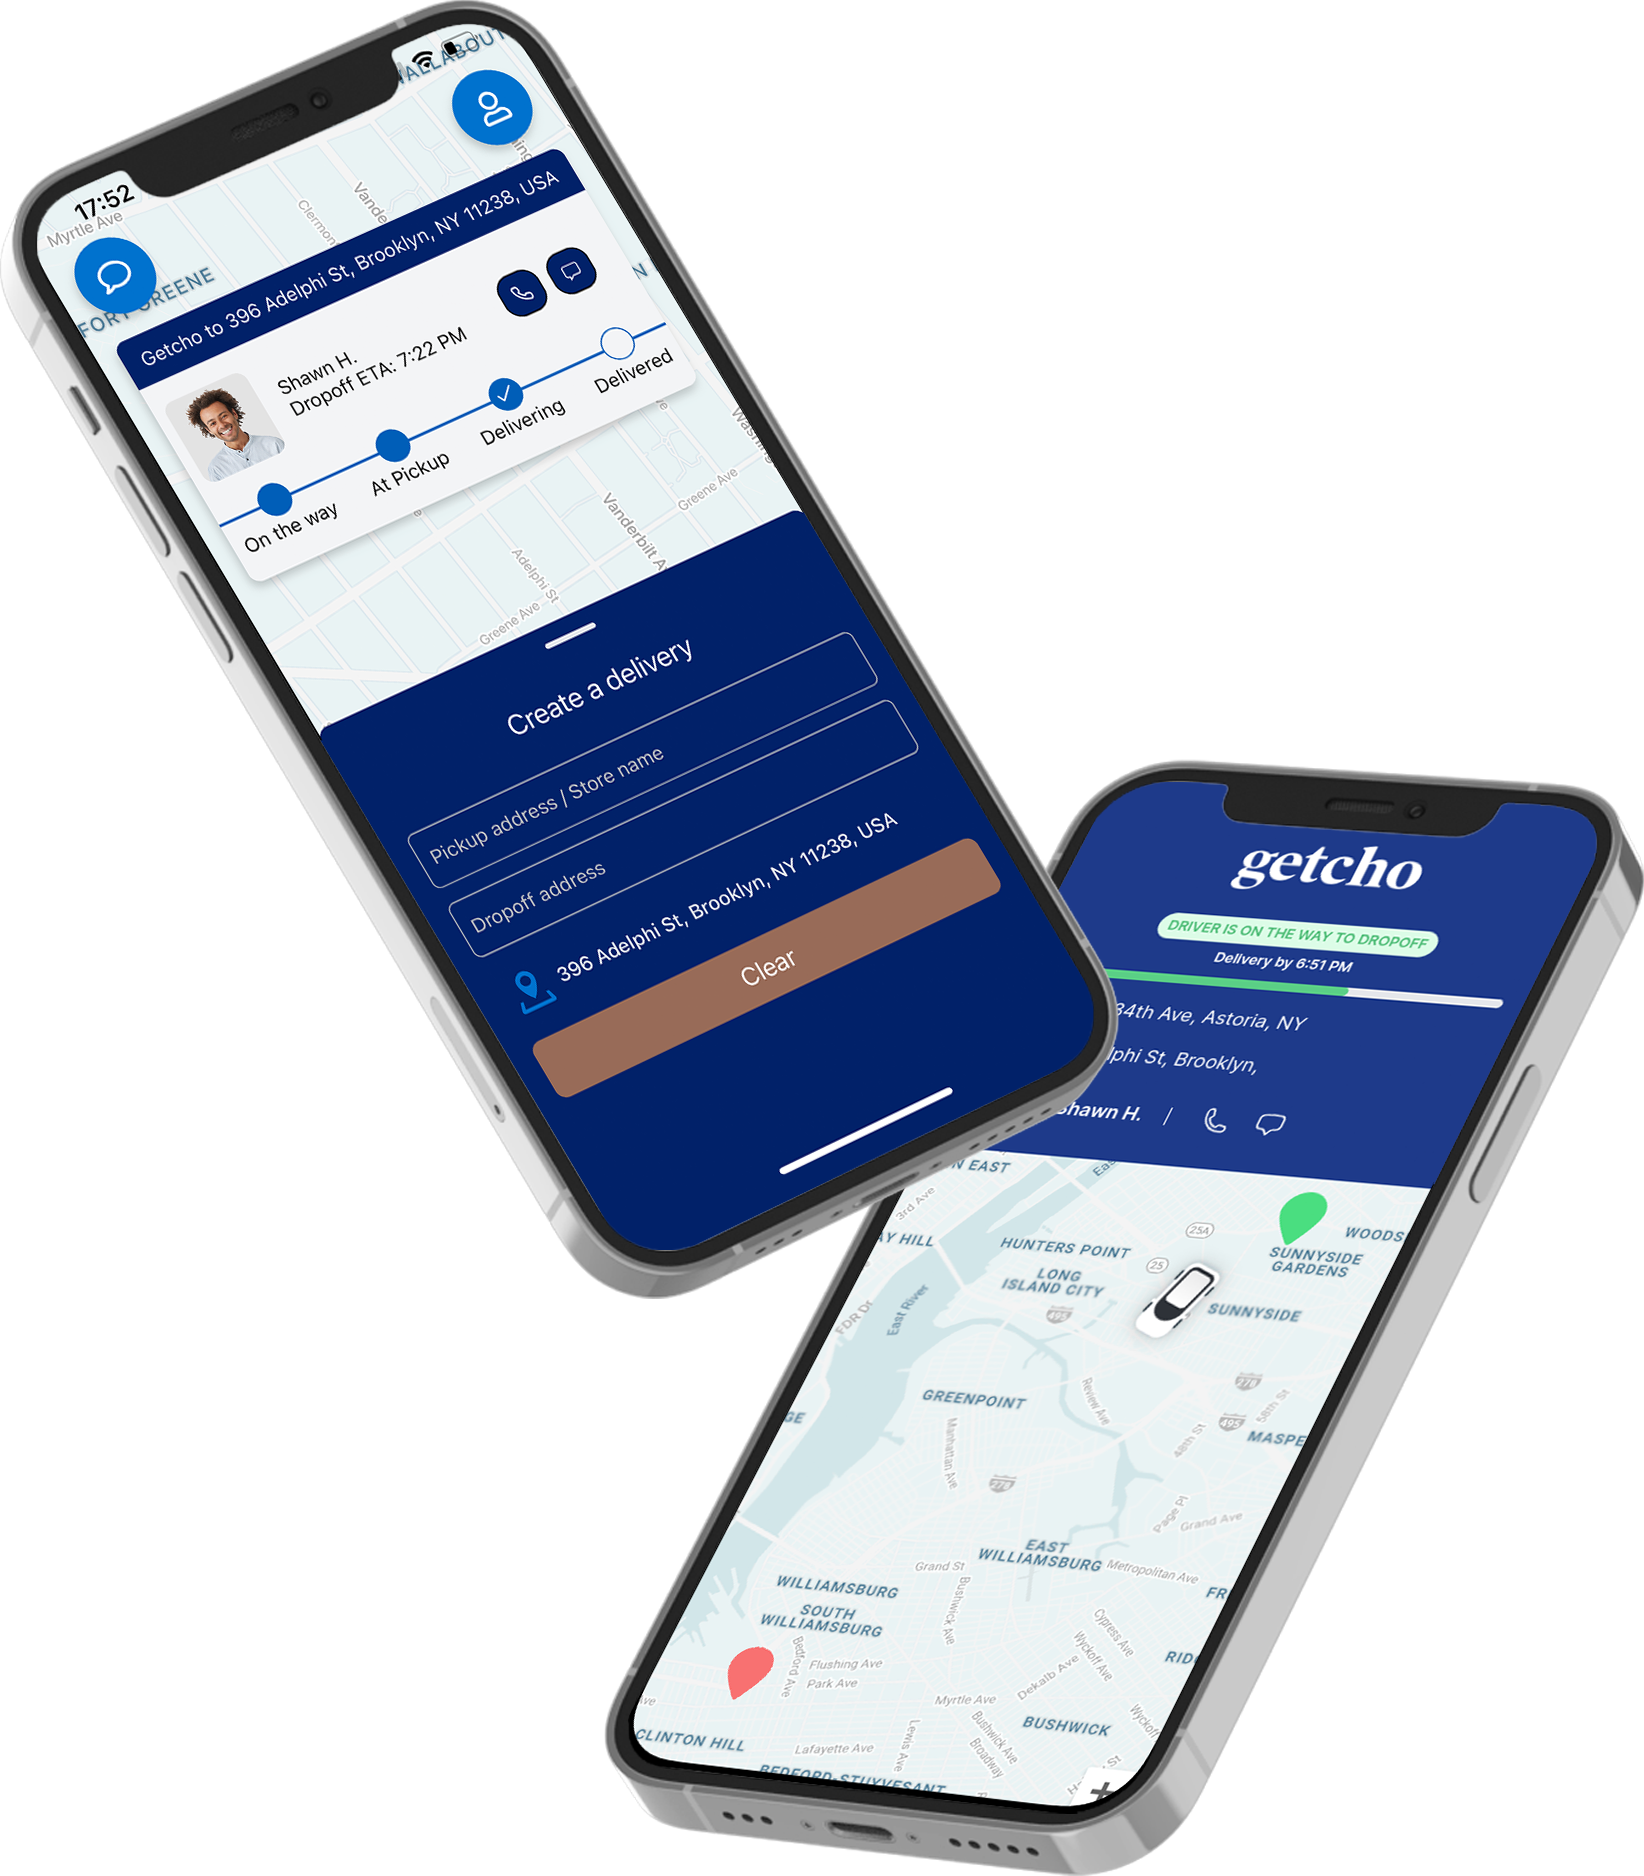
Getcho is an on-demand courier service and sister firm to K-Optional. You can use Getcho to dispatch a delivery from its iOS and Android apps.
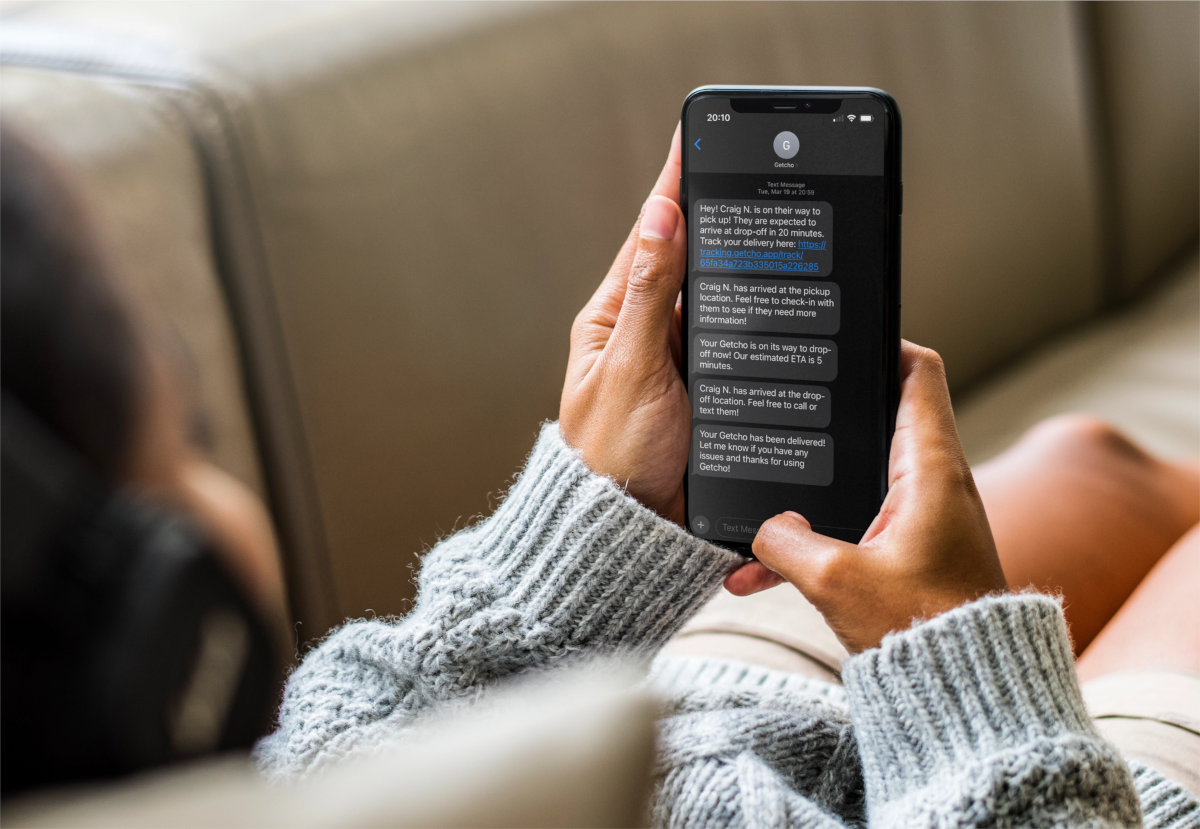
Getcho’s support team uses Twilio to talk to users. Sometimes they send automatic notifications such as “we’re at pick-up now”. Other times, a human agent types up a message.
Over the past few years, Getcho has managed tens of thousands of support chats; that includes plenty of data on both sides of July, 2023.
We helped Getcho examine response rates and analyze how user interaction has changed.
The problem - confounding factors and an improving brand
We defined a “response” as a message from a user that we messaged less than 24 hours before. We only looked at the first exchange with each user.
We ran the numbers and found that users replied twice as often after July 2023 (40% vs 80%). That was easy.
Except we knew this was hardly a controlled experiment. For one thing, Getcho probably wasn’t sending the same types of messages then and now. If they improved their verbiage, then any insight goes out the window.
On top of that, users probably reply more as a brand becomes reputable. Though Getcho isn’t Uber yet, their active users have doubled a few times this year. UI and branding have improved. It’s hard to ignore that factor in the data.
The solution - looking at response rates across vector embedding clusters
We accepted that we couldn’t divorce reputation and response rate. So we’d have to take the data with a grain of salt.
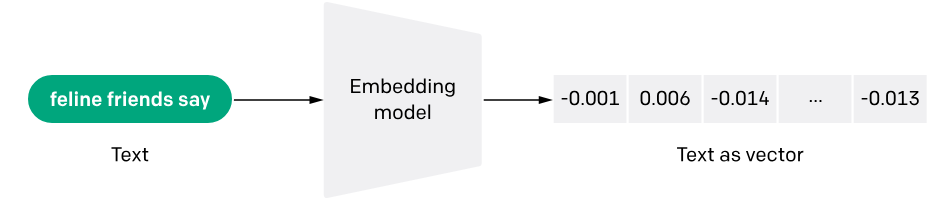
But maybe we could control any changes we made to our text message content. Inspired by Simon Wilson’s primer on vector embeddings, we created 10 clusters of the text messages we sent and examined those response rates. In other words: “break our outbound texts into 10 types and give us the response rate for each”.
Then we took a few dozen messages from each cluster, and had the GPT API generate an exemplar message which we used to label the group.
The results
- Users responded slightly less to status updates. Message: “Your courier, Jack has arrived”. Before: 38%. After 35%.
- Users responded thrice as likely to engagement messages. Message: “Hi there, I saw you checked a delivery price, but didn’t dispatch. Is there something I can help you with?“. Before: 7%. After: 21%.
- Users responded more to niceties and greetings like “thanks, have a nice day.” Before: 38%. After: 54%
- We sent more messages of the high-response types after July of 2023. This would indicate that better rates come at least in part from our messaging.
We can’t conclude definitively that A2P changes helped response rates, but the apples-to-apples comparison of each category makes it seem that way.